
Storm Damage Risk
The storm damage risk quotes the storm damage of residential buildings which is exceeded at a given level of probability. The quantification of this risk taking into account wind climatology, vulnerability and value of the buildings. It is used as general basis of risk assessment.
Project description
Introduction
In Germany, winter storms are by far the costliest natural catastrophes, causing more than 50% of the economic and more than 45% of the insured damage (Munich Re, 2005) of all catastrophic natural events.
Born from disturbances of low-pressure regions over the Atlantic Ocean and driven by high temperature differences in winter, destructive storms often cause widespread, sometimes European-wide damage to persons, buildings, and nature. In contrast to tornados and thunder storms, winter storms are characterised by high wind speeds over large areas.
The prediction of such systems is solely possible from several hours to very few days depending on weather conditions.
The most damaging events in Germany were Capella (1976, 11 deaths, >250 Mil. Euro total damage), the storm series of Vivian, Wiebke, Daria (1990, >50 deaths, >2000 Mil. Euro) und Lothar (1999, 18 deaths, 2000 Mil. Euro). Maximum wind speeds of more than 150km/h in open country and of 220-270km/h in mountainous regions were recorded.
Damage due to winter storms can be subdivided in direct damages (to buildings, infrastructure, forests, automobiles, …) and indirect losses (due to cleanup efforts, loss of production, …). Only a part of all damages are insured, thus, total loss are often two times higher than insured losses.
The average storm damage to buildings amounts to approximately 1300 €. Most damage occurs to the envelope of buildings, roof tiles, roofing structure, windows, rolling shutters, outdoor structures. Total collapse of buildings is very uncommonly recorded as German buildings are mainly brick or concrete structures (wooden structures are very uncommon).
Method
For the storm damage risk assessment, the amount of damage and the number of damaged buildings which are expected during a period of time are calculated. Storm risk is therefore a combination of storm hazard, vulnerability of buildings and value of buildings.
Risk = hazard * vulnerability * value
The storm hazard specifies the probability of occurrence of maximum wind speed at a certain place.
In a first step data of the German Weather Service (DWD) are used to detect the strongest past storms for the period 1971 to 2000. For each of these storms the surface wind is simulated by using the numerical model KAMM (Karlsruhe Atmospheric Mesoscale Model). The model is initialised with ERA40 reanalysis data of the ECMWF (European Center for Medium range Weather Forecasting). Then land cover dependant gust factors are adapted to the modeled mean wind speeds.
Finally extreme value statistics is used for the probability calculation of the occurrence of certain wind speeds.
The vulnerability of buildings to storm damage are modelled using damage functions. These functions calculate damage based on information of meteorological, topographical and structural parameters. The developed function is calibrated to damage data of past storm events.
Buildings assets are estimated by the CEDIM Asset Estimation Group link_to_AEG and represent the buildings replacement costs of the year 2000.
Integration of the risk curves results in the average annual damage, that reflects the monetary amount that would have to be set aside each year to cover the full range of future damage.
Results
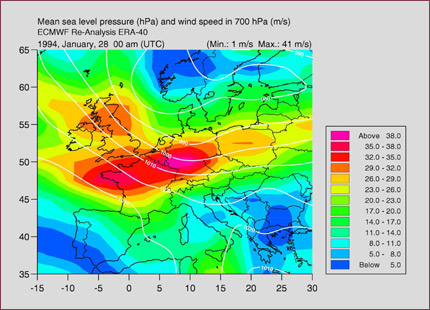
| Wind field and mean sea level pressure of gale Lore on 28 January 1994. The data derive from the ERA40 reanalysis data set of the ECMWF. |
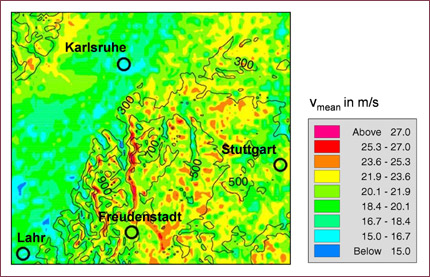
| The model simulation by KAMM is subject to the boundary conditions of the ECMWF global model (above). Shown are the mean wind speeds of gale Lore for a subarea of Southwest Germany. |
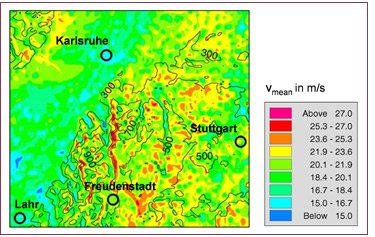
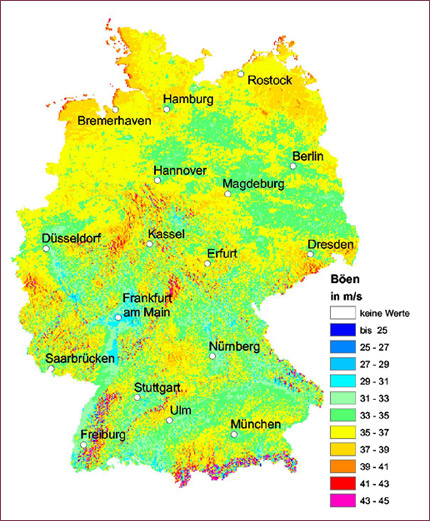
| Maximum gust speeds in Germany with an exceedance probability of 0.02 per year (equals a mean return period of 50 years). |
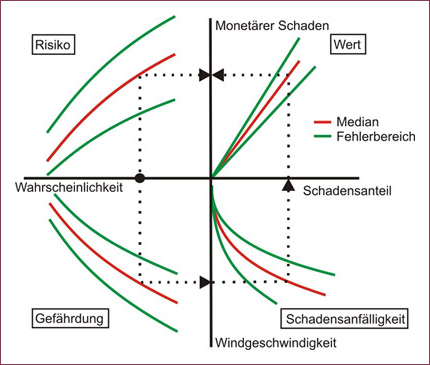
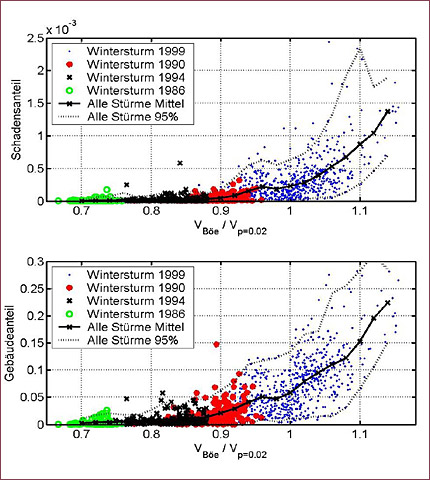
| Relationship between normalized wind speed and damage to buildings. The upper curve shows the damage ratio, the lower curve the claim ratio. |
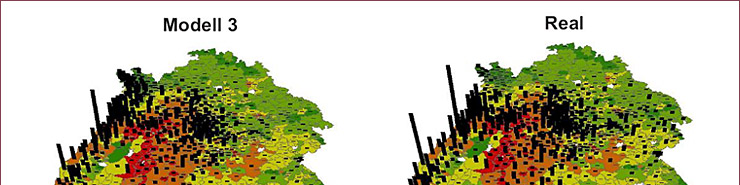
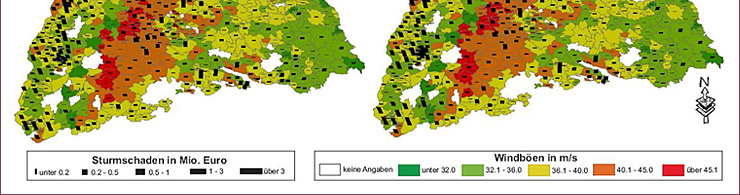
Comparison between simulated and observed damage distribution of winter storm „Lothar“ in December 1999. The black bars represent the amount of damage within a 5-digit postal code zone, the underlying colours denote the maximum wind speeds calculated with KAMM.
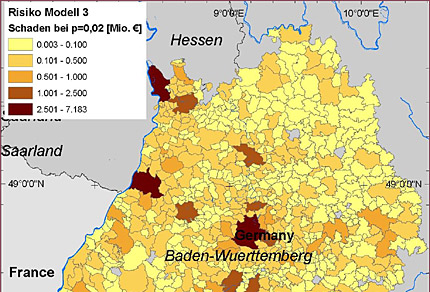
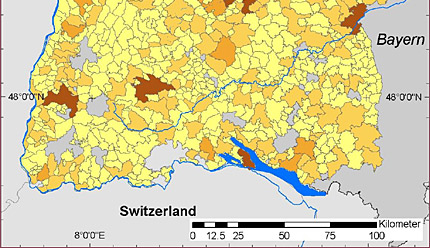
| Damage risk map for residential buildings in the German state of Baden-Württemberg. The map shows the loss in million Euro at an annual probability level of 2%. This means, there is a 2% chance of the given value being exceeded during a period of one year. |
Publications
| Heneka, P., Ruck, B. | Vulnerability of buildings to storm damage in Germany | Proceedings of ICWE 12, Cairns, Australien, 2007 |
| P. Heneka, T. Hofherr, B. Ruck, C. Kottmeier | Storm damage risk assessment in Germany | 3rd Indo-German Workshop and Theme Meeting on “Seismic Safety of Structures, Risk Assessment and Disaster Mitigation”, Mumbai, March 12-14, 2007 |
| P. Heneka, T. Hofherr, B. Ruck, C. Kottmeier | Winter storm risk of residential structures – model development and application to the German state of Baden-Württemberg | Natural Hazards and Earth System Sciences (2006) 6: 721 – 733 | » Link |
| Heneka, P., Hofherr, T., Ruck, B. and Kottmeier, C. | Damage risk of winter storms in Germany | Proceedings of ICDR Davos, 2006 |
| Tyagunov, S., Heneka, P., Stempniewski, L., Zschau, J., Ruck, B., Kottmeier, C. | CEDIM: From Multi-Hazards to Multi-Risks | AMONIA Proceedings, Barcelona, Dezember 2005 |
| Heneka, P. und Ruck, B. | Development of a storm damage risk map of Germany - A review of storm damage functions | Proceedings of the International Conference for Disasters and Society, Karlsruhe, 2004 |