
Project Description
Between October and March, winter storms account for most of the weather-related damage in large parts of Central Europe; with the particularly violent winter storm "Kyrill" in January 2007, the damage alone to insured buildings reached more than 2 billion US $. Other well-known representatives of violent winter storms are, for example, "Anatol" or "Lothar" in 1999. Within the scope of the present project, winter storms are recorded, classified and evaluated with the aim of developing a routine forecasting system with which the damage potential of current or imminent winter storms can be reliably estimated.
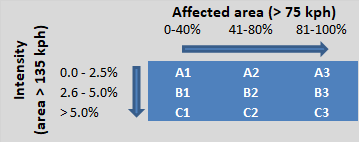
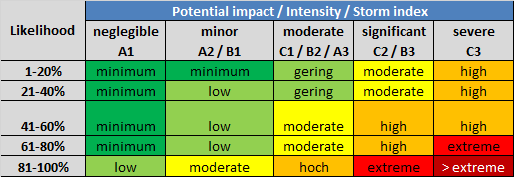
The damage potential can be described by a simple windstorm index that takes into account both the area affected by the storm and the peak wind speeds that have occurred. The data source is the recorded maximum daily gusts at the stations of the measuring network of the German Weather Service. The letters represent the intensity of a winter storm (percentage of land area where the peak gusts exceed 135 kph). The extent of the storm field is described by the numbers 1, 2 or 3, depending on which proportion of area the wind reaches at least storm strength (75 km / h).
|
|
|
Figure 1: Storm index based on recorded daily wind gusts of the measuring network of the German Weather Service |
|
|
|
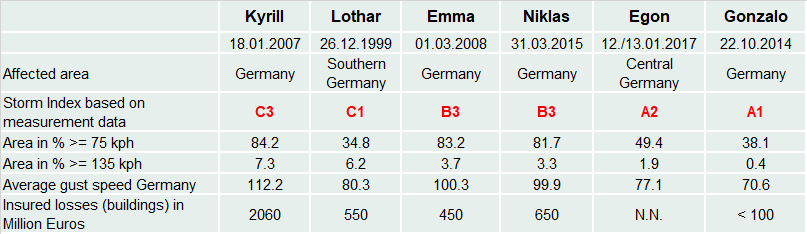
Figure 2: Storm index of a few past winter storms in Germany |
The large variability in the representativeness of the measured wind speeds (different measurement heights, different environmental conditions) necessitates a normalization of the wind gust data; In addition, gusts of the same velocity have a completely different damage potential in different regions. Coastal areas or the highlands of the low mountain ranges are more often exposed to high wind speeds and are usually less prone to damage than lowlands of the interior. The standardization is done with the measurement data of the entire time series of each station and with sufficiently long data sets (for example over a period of 5 or 10 years) local peculiarities of the measurement at a specific station can be eliminated. Particularly well suited is the use of the 98% quantile of the daily values of the peak gusts of the entire recording period of a station (for example Klawa and Ulbrich, 2003). The data sets of all standardized measurement series which are calculated and updated on a daily routine can be converted into an index that qualifies both historical and current storms for entire Germany.
|
|
|
|
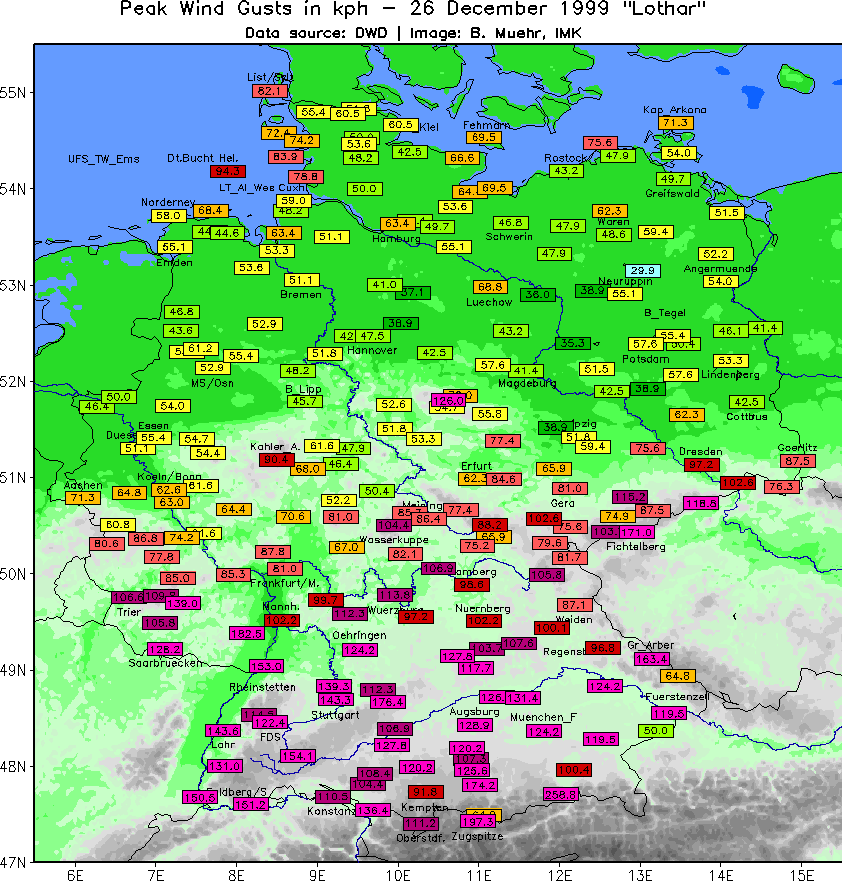
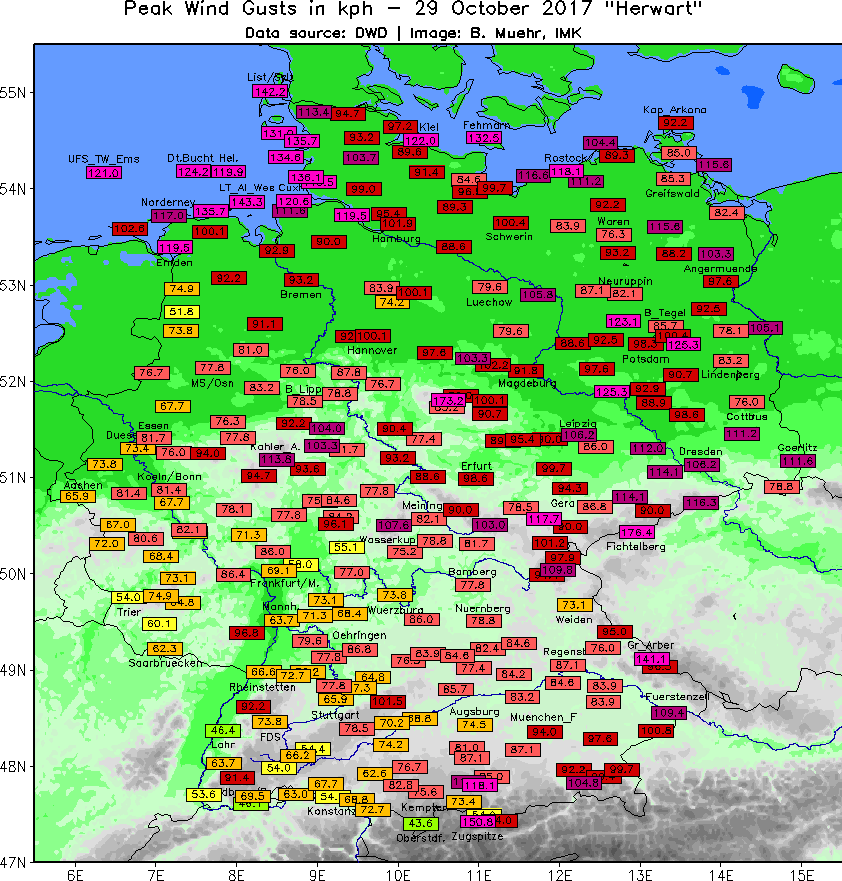
Figure 3: Peak wind gusts of „Lothar“, 26.12.1999 (left) and „Herwart“, 29.10.2017 (right). The colors represent the Bft-scale; read: Bft 9 (75 kph), pink: Bft 12 (> 117 kph). Data source: German Weather Service. |
|
With the help of top wind speed data from current and historical winter storms, population density data from Germany or insured values, as well as loss data from insurance for past storm events, a forecasting system can be implemented that integrates current ensemble peak wind forecast data from one or more weather forecasting models into a storm risk matrix. The storm risk matrix provides information on the likelihood that certain wind thresholds will be exceeded and what damage an approaching storm low in Germany might probably cause.
|
Figure 4: Storm risk matrix based on occurrence probability and storm intensity. |