Are drought events becoming more frequent in the Rhine catchment?
Over the last 50 years, extreme drought events were irregular, a couple of them at the end of the 70s and after the year 2000 (UFZ Helmholtz Zentrum für Umweltforschung, 2023). The most recent occurred in 2018, where the effects were noticeable on west-central Europe (Toreti et al., 2019). Across the Rhine River basin, the combination of high temperatures and lack of precipitation led to low groundwater levels and streamflow (Aalbers et al., 2022). Consequently, the transportation of goods along the river was interrupted and the monetary losses reached values of approximately 2 billion Euros (Internationale Kommission zum Schutz des Rheins, 2020).
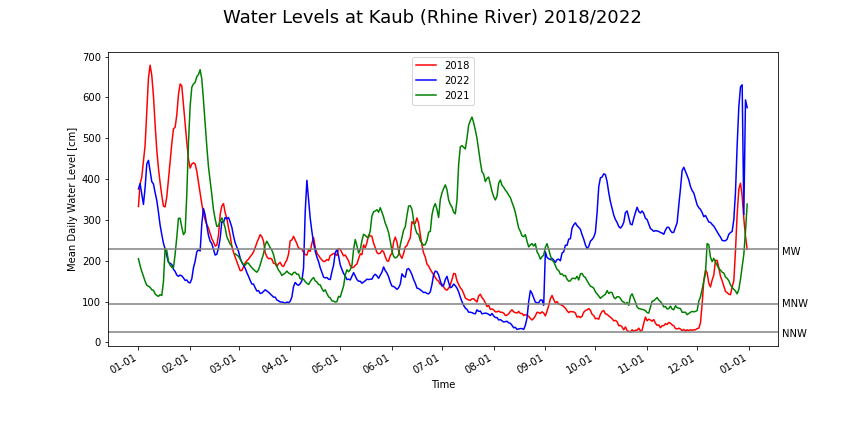
Similar climate conditions from the 2018 drought event were observed yet again in 2022. Record high temperatures since the beginning of the year, and a significant decrease in precipitation since March, were among the most significant indicators. At Kaub station the water level almost reached the record lowest value in August (Fig. 1). The duration of the event was shorter in 2022 due to large rainfall events towards the end of August. Compared to a wet year (2021), it can be observed the influence of lack of precipitation over the summer months and high temperatures from spring on the discharge values (Fig. 2).
The CEDIM Project "Impact of recent and future drought events on river discharge and fluvial transport sector for the Rhine River", will assess the present day and future navigability of the Rhine River by using the regional climate model ensemble LAERTES-EU (Ehmele et al., 2022) to spot not yet observed drought periods under current climate conditions, and a pseudo-warming approach to estimate the impacts of climate change on the streamflow. First, the hydrological WRF-Hydro model will be calibrated and tested using recent drought events along the Rhine River. The second step consists of scanning the LAERTES-EU data set, which provides 12.000 years of present-day climate, for extreme drought periods. Finally, observed extreme events will be simulated under warmer background climate (+2K and +4K) and soil moisture conditions.
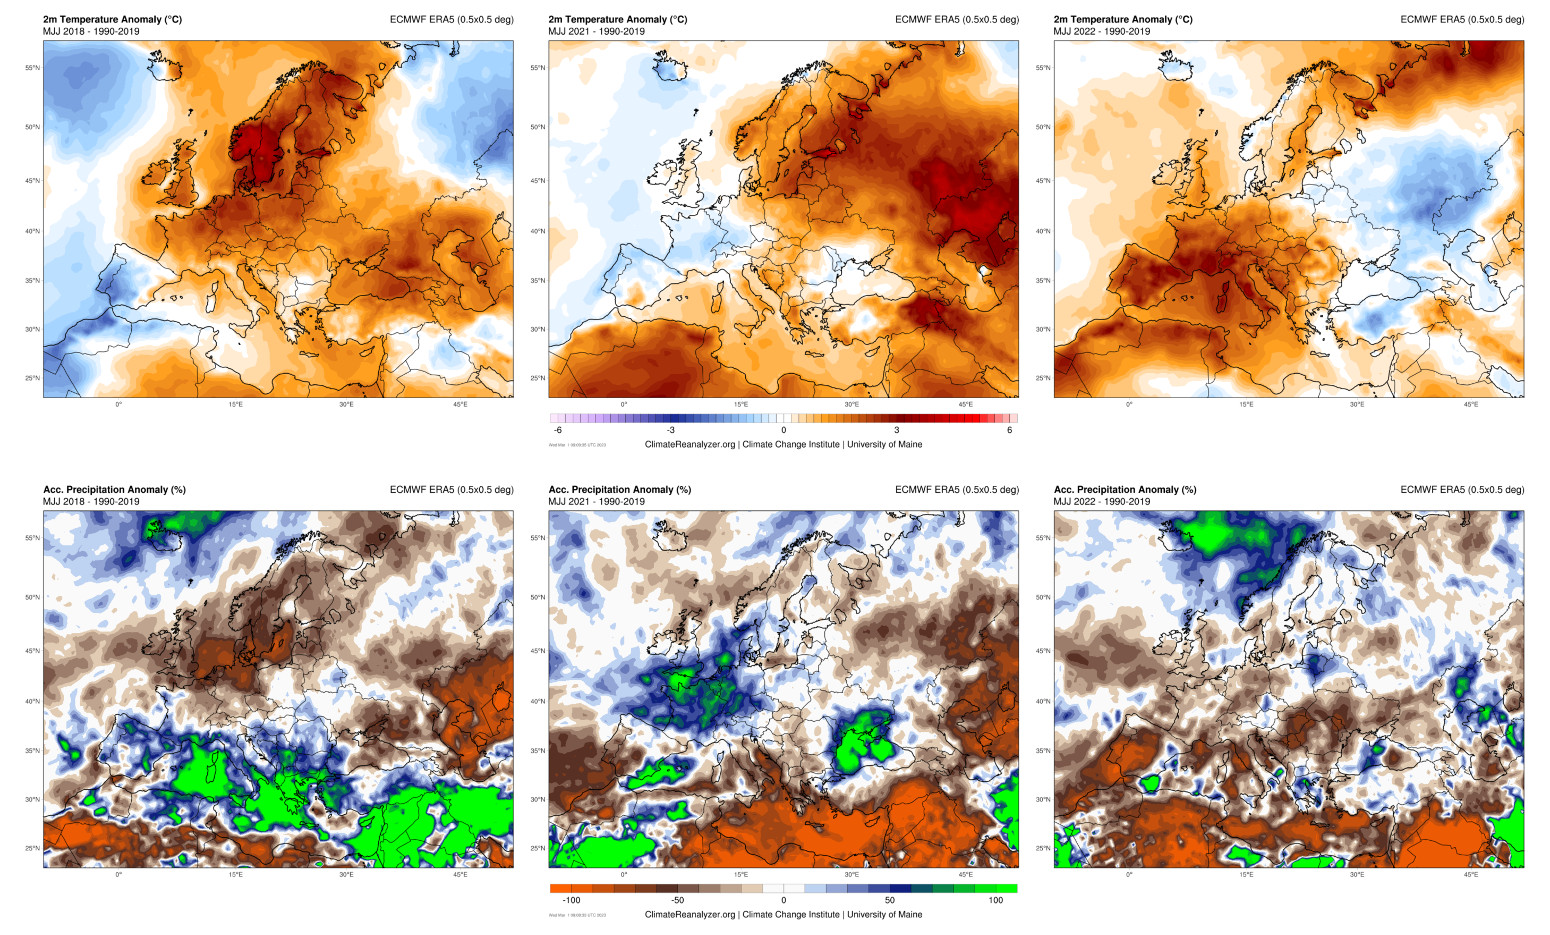
Fig. 2: Monthly relative accumulated precipitation and temperature anomalies for 2018 (left), 2021 (middle) and 2022 (right) in Europe (May, June, July) season in comparison with the period 1990–2019 (Data/Image: Climate Reanalyzer, Climate Change Institute, University of Maine, USA).
References:
Aalbers, E., Van Meijgaard, E., Lenderink, G., de Vries, H., & van den Hurk, B. J. (2022). The 2018 west-central European drought projected in a warmer climate: how much drier can it get? EGUsphere[preprint]. doi:https://doi.org/10.5194/egusphere-2022-954.
Ehmele, F., Kautz, L.-A., Feldmann, H., He, Y., Kadlec, M., Kelemen, F. D., Lentink, H. S., Ludwig, P., Manful, D., and Pinto, J. G. (2022). Adaptation and application of the large LAERTES-EU regional climate model ensemble for modeling hydrological extremes: a pilot study for the Rhine basin, Nat. Hazards Earth Syst. Sci., 22, 677–692, https://doi.org/10.5194/nhess-22-677-2022.
Internationale Komission zum Schutz des Rheins (IKSR). (2020). Bericht zum Niedrigwasserereignis Juli-November 2018. Koblenz: IKSR-CIPR-ICBR. Retrieved from https://www.iksr.org/fileadmin/user_upload/DKDM/Dokumente/Fachberichte/DE/rp_De_0263.pdf.
Toreti, A., Belward, A., Perez-Dominguez, I., Naumann, G., Luterbacher, J., Cronie, O., . . . Zampieri, M. (2019). The exceptional 2018 European water seesaw calls for action on adaptation. Earth’s Future, 7, 652-663. doi:https://doi.org/10.1029/2019EF001170.
UFZ Helmholtz Zentrum für Umweltforschung. (2023, 02 17). Dürrenmonitor Deutschland. Retrieved from UFZ Helmholtz Zentrum für Umweltforschung: https://www.ufz.de/index.php?de=37937.
Associated institute at KIT: Institute of Meteorology and Climate Research (IMK-TRO)
Author: Andrea Campoverde Márquez (March 2023)