
When and why do different weather extremes cluster?
A single extreme meteorological event can hit a society, economy and environment very hard. However, if several events occur at short intervals, this can further aggravate the damage of the individual events, e.g., through blocked traffic routes or through overburdened authorities. These events are typically referred to as compound events or multi-hazard events (e.g., Zscheischler et al. 2020, UNDRR 2016). This CEDIM project, funded by the Foundation "Environment and Damage Prevention", investigates the serial clustering, i.e., the occurrence in close succession, of different types of damage-relevant extreme events (floods, hail and storm events). The aim of the project is to identify cluster periods of different extremes and to evaluate potential large-scale atmospheric patterns linked to these cluster periods. With the help of climate models, the future development of different clusters can be assessed. This can e.g. help to better prepare for these clustered events.
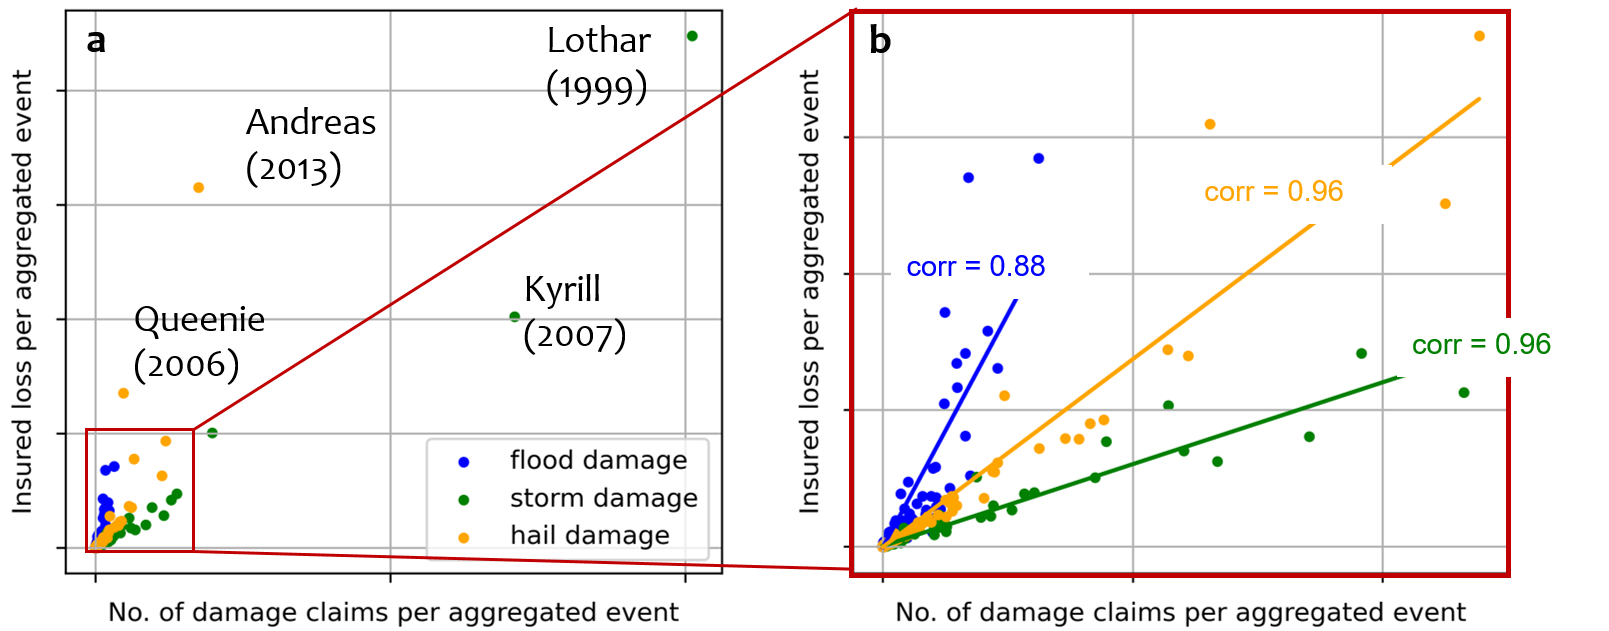
Events are identified on the basis of the damage reported to a building insurance company and the amount of insured damage. Data cover the time period from 1986 to present and the federal state of Baden-Württemberg. Here, the proportion of insured buildings is particularly high in a nationwide comparison. Looking at the number of insured buildings and the total insured damage, two winter storms (Lothar, Kyrill) and two hail events (Andreas, Queenie) stand out (cf. Figure 1a). These four events caused about 30% of the total insured loss incurred in the period 1986-2020. Furthermore, the insured loss (per event type) is approximated quite well by the number of claims (cf. correlations in Fig. 1b).
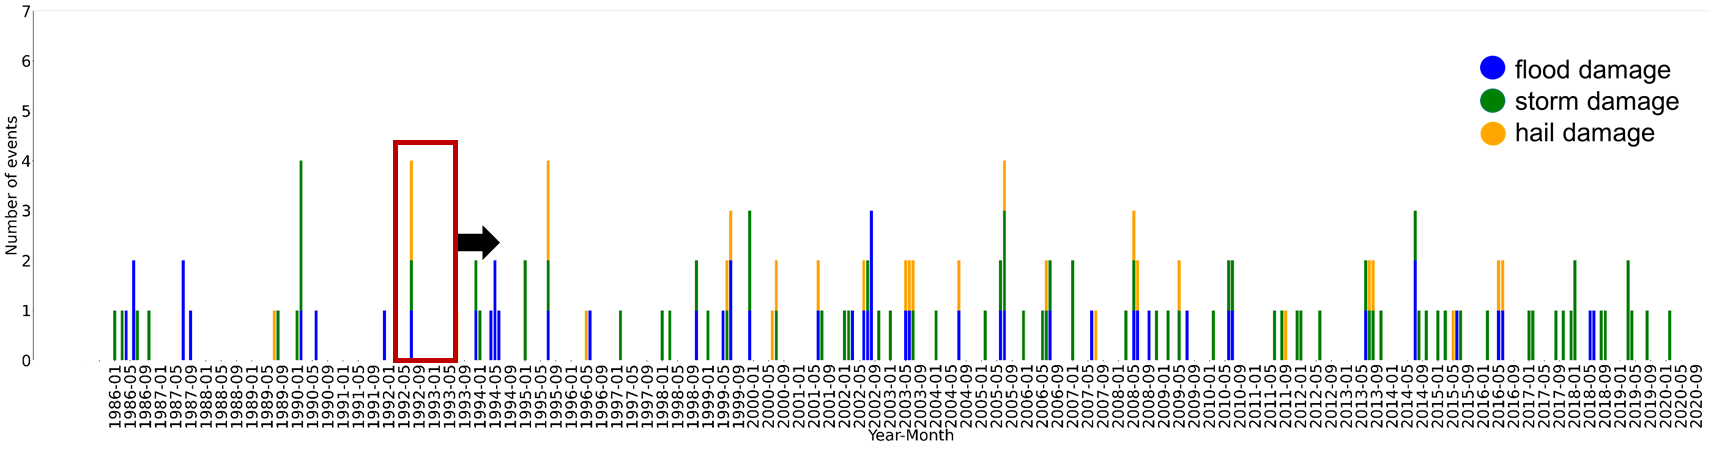
Serial clustering of events is investigated using an algorithm that defines time periods with clustering based on the number of events and the amount of insured loss (cf. Kopp et al. 2021). Figure 2 shows an example of a time series for the 1% of the worst loss events, as well as which (running) 30-day windows show several events of the same or different type. With the selected thresholds, four periods with the occurrence of all three different event types are obtained. Subsequently, the degree of clustering is examined using the dispersion index (Mailier et al. 2006) as well as Ripley's K (e.g., Tuel et al. 2021). Results show that the degree of clustering depends on both the method chosen and the event definition (peaks-over-threshold method vs. standard method with a fixed number of days).
In order to analyse the triggers of the previously identified clustering, a meteorological refinement of the purely economic data is necessary. This refers, e.g., to the separation between synoptic and convective storm and precipitation events and is carried out with the help of lightning data, filtering with pressure gradients and precipitation totals as well as using various parameters in reanalysis data (ERA5). Clustering can result from dominant large-scale atmospheric circulation patterns, for example due to anomalies in the position of the jet stream. This can be categorised, for example, by the North Atlantic Oscillation or by characteristic weather regimes over Europe (Grams et al. 2017). It will then be investigated how certain patterns favour clustering, first with statistical and then with machine learning methods.
References:
- De Ruiter, Marleen C., et al. "Why we can no longer ignore consecutive disasters." Earth's future 8.3 (2020): e2019EF001425.
- Grams, Christian M., et al. "Balancing Europe’s wind-power output through spatial deployment informed by weather regimes." Nature climate change 7.8 (2017): 557-562.
- Kopp, Jérôme, et al. "A novel method to identify sub-seasonal clustering episodes of extreme precipitation events and their contributions to large accumulation periods." Hydrology and earth system sciences 25.9 (2021): 5153-5174.
- Mailier, Pascal J., et al. "Serial clustering of extratropical cyclones." Monthly weather review 134.8 (2006): 2224-2240.
- Tuel, Alexandre, and Olivia Martius. "A global perspective on the sub-seasonal clustering of precipitation extremes." Weather and climate extremes 33 (2021): 100348.
- UNDRR (2016). Report of the Open-Ended Intergovernmental Expert Working Group on Indicators and Terminology Relating to Disaster Risk Reduction.
- Zscheischler, Jakob, et al. "A typology of compound weather and climate events." Nature reviews earth & environment 1.7 (2020): 333-347.
Associated institute at KIT: Institute of Meteorology and Climate Research (IMK-TRO)
Autor: Katharina Küpfer (July 2023)