Heat stress in changing societies and a changing climate
Heat exposure is defined as the intersection of high temperatures and the affected population. Thus, it captures the temperatures to which people in a given geographical area are actually exposed. Our analysis (Schäfer et al., submitted) systematically separates these two factors to accurately assess their respective national-level impacts.
One of our key findings is that demographic developments can significantly impact national heat exposure. For instance, migration within the United States, particularly to the warmer southern and western regions, has increased overall heat exposure and exacerbated the effects of climate change. This clearly demonstrates that population shifts are a significant contributor to heat-related risks.
Additionally, our analysis shows that global climate models exhibit regional biases compared to historical observational data. Notably, recent warming trends are underestimated in many regions. This suggests that future heat risks in some areas could be greater than previously assumed.
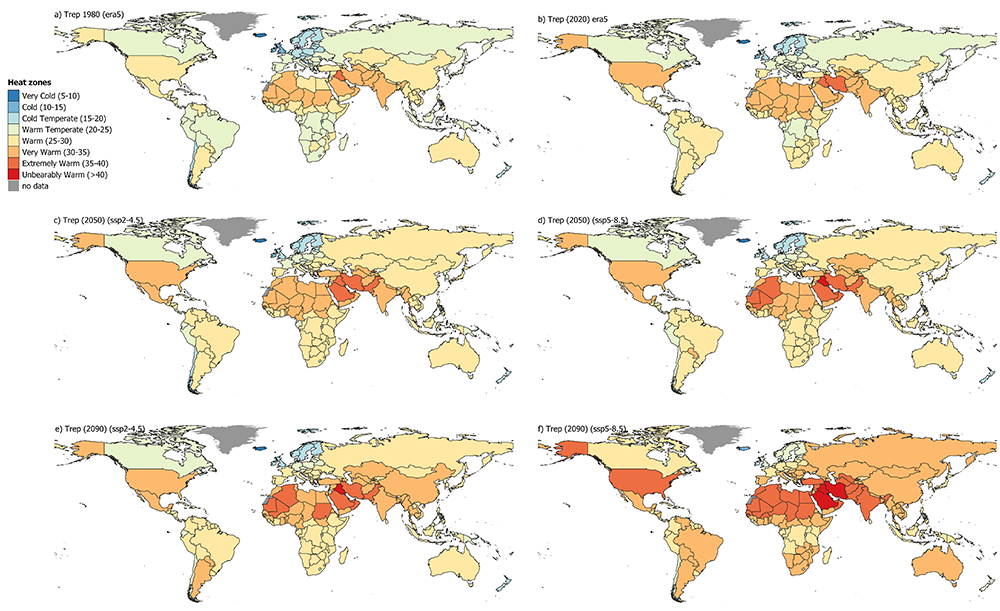
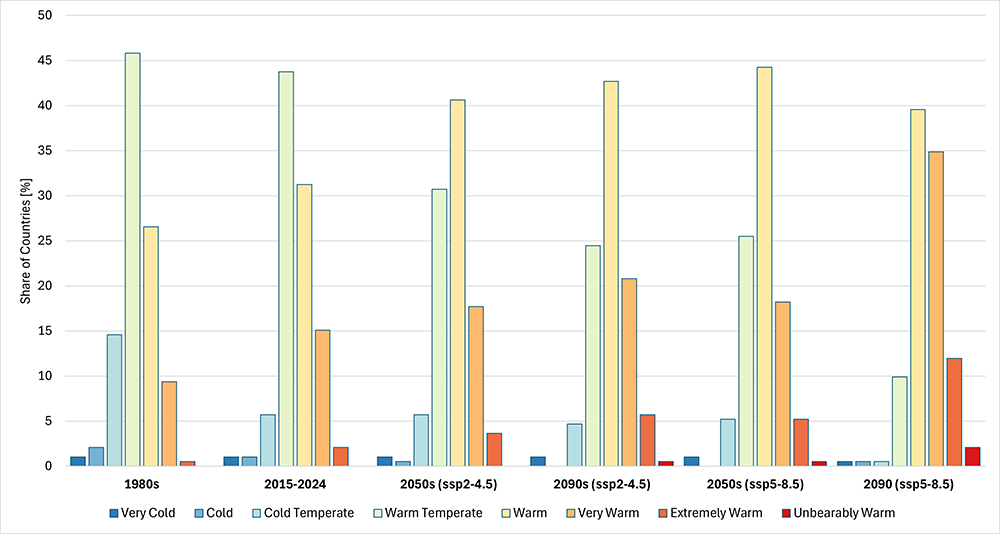
To simplify the presentation of these risks, we have introduced a qualitative classification system for so-called "heat zones." Climate projections forecast a significant global shift, with many temperate countries moving into the “warm” or “very warm” categories. In a high-emission scenario, regions such as the Middle East could experience "unbearable heat" by the middle of the century—an unprecedented level of extreme heat.
Our findings underscore the need to systematically link high-resolution climate data with demographic developments. This is the only way to make accurate risk assessments and develop effective adaptation strategies.
Reference:
Schaefer, A.M., P. Ludwig , S. Mohr, S. Krikau, B. Mühr , S. Benz, M. Kunz (2025): The evolution of heat stress in changing societies and a changing climate from 1960 to 2100, Frontiers in Climate - Climate Monitoring (Re-submission).


Showing the shift from a majority of cold and temperate countries to mostly warm.
Associated institute at KIT: Geophysical Institute (GPI), Institute of Meteorology und Climate Research Troposphere Research (IMKTRO)
Authors: Andreas Schäfer, Patrick Ludwig (June 2025)

