
How climate risks in tourism are shifting
Each year, climate change poses an increasingly significant challenge to global tourism. Climate risks are shifting just as rapidly as global climate zones. The 'Global Tourism Climate Exposure Layer' (G-TCEL) is being developed to accurately map these risks within the context of the travel industry. It is a transparent, scalable model that analyses global climate hazards and translates them into tangible risk assessments within a regional context. This approach is unique in that it does not rely solely on raw climate data; rather, meteorological values are cross-referenced directly with tourism indicators and respective landscape features to illustrate the actual risks clearly.
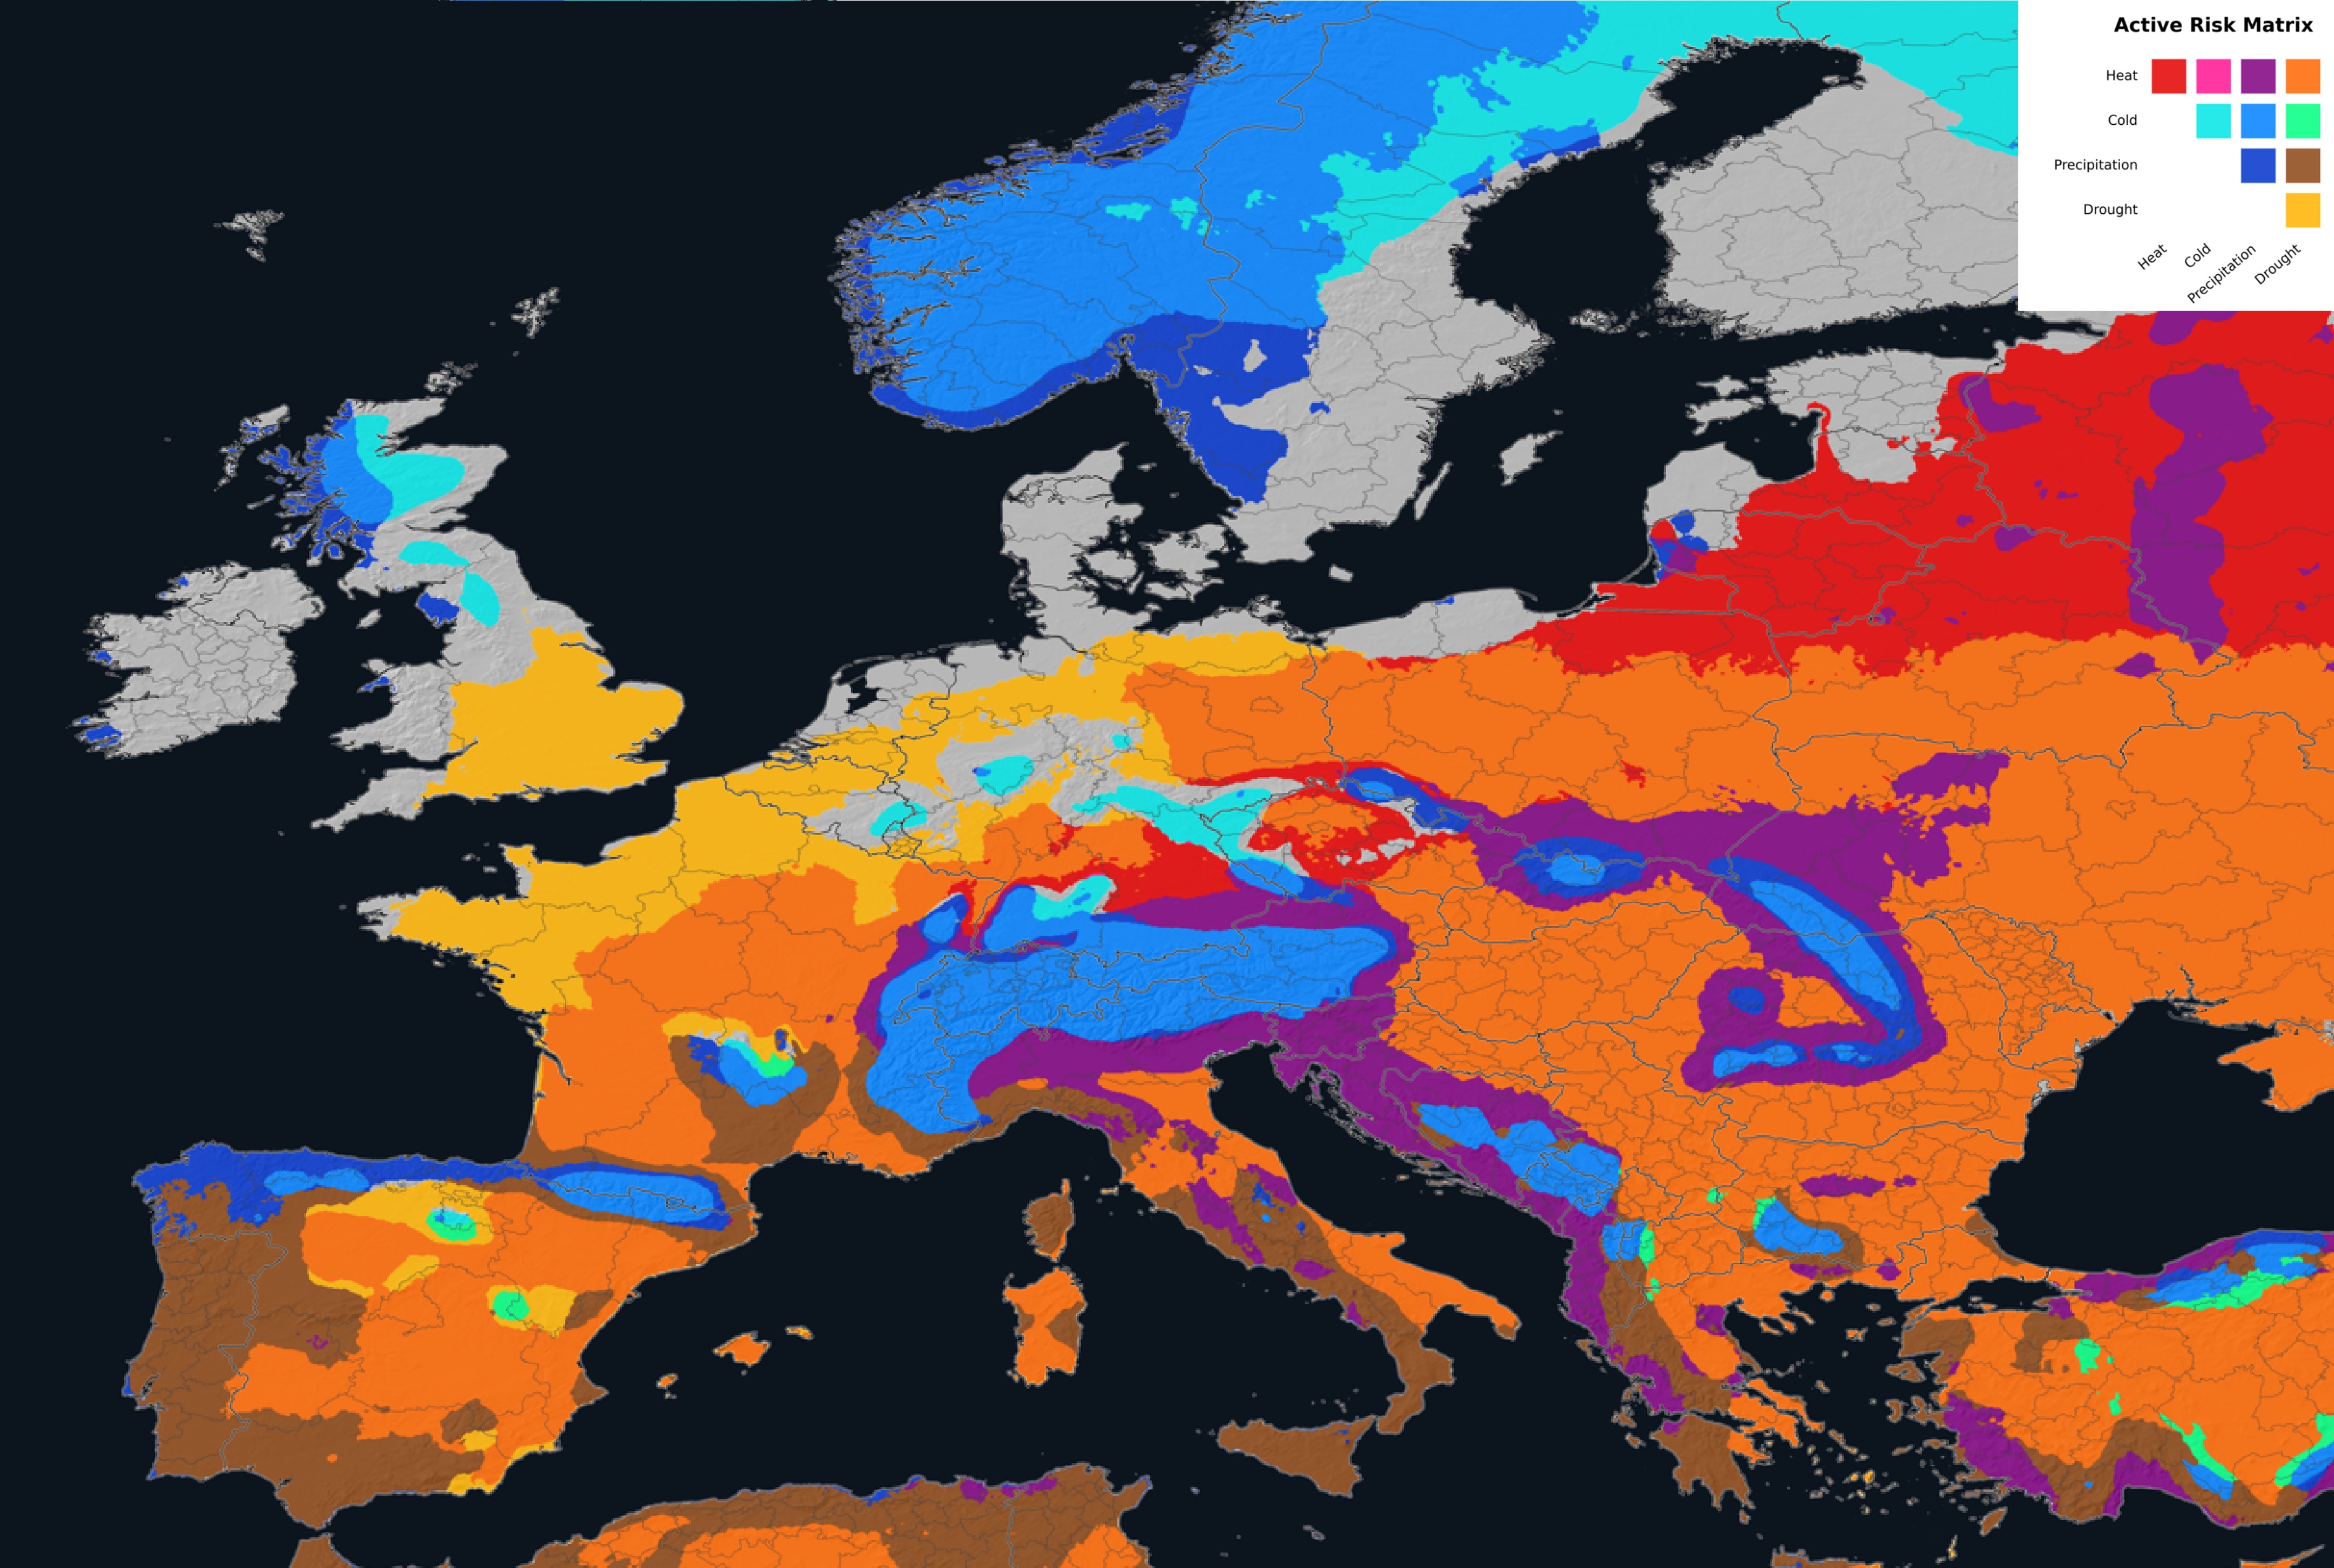
Rather than considering risks in isolation, the G-TCEL model evaluates four to nine different climate hazards, depending on the application. These include heat, cold, precipitation, and drought, which can be divided into subcategories (e.g., heat and heat stress). These hazards result from the combined analysis of various climate indicators, such as the number of hot days or maximum temperature, which have been converted into a simple 0-to-100 scale for easier understanding (Fig. 1). However, the most important aspect of such index scales is local relevance. For example, a temperature of 40°C has a completely different meaning in Stuttgart than in Egypt. For this reason, locally relevant thresholds were established for all examined indicators. This ensures that, if the index rises above 50, it indicates a significant shift toward more serious climate risks for the location in question.
These results were then aggregated at the regional level. This process is more complex than simply calculating a spatial average. Locations that play a central role in tourism, such as those with a high density of hotels or large visitor numbers, are given significantly greater weight in the analysis. The results are finally categorized into four landscape types, or tourism typologies: urban areas, rural natural areas, mountainous regions, and coastal regions. This differentiation enables us to consider the climate impacts for each area separately because every landscape has its own unique requirements and challenges.
This model enables us to derive two compelling metrics that highlight the consequences of climate change:
- Climate Risk Zones: These zones are determined by combining the two most dominant local risks, provided each risk has an index of at least 50. Southern Germany is an example of a drastic change: While the region was historically characterized primarily by cold and precipitation in 1980, projections show it evolving into a landscape dominated by heat, either in combination with drought or heavy precipitation.
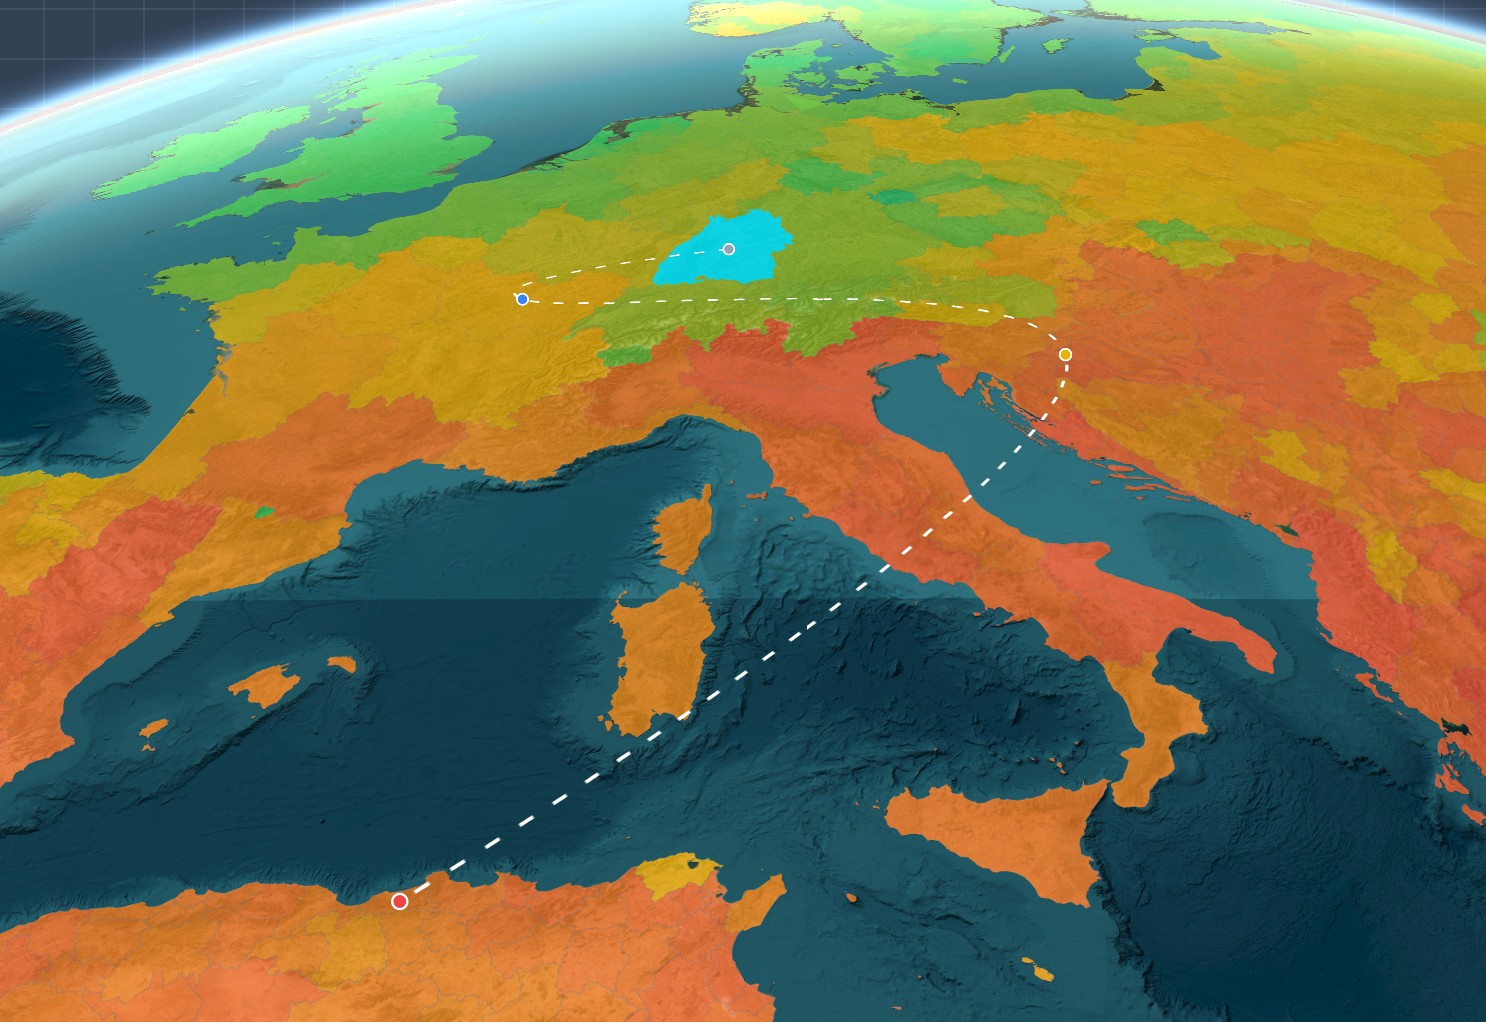
- Climate Twin: This concept identifies locations that currently or historically have a climate similar to what we expect in our home region in the future. Over time, this allows us to map out a "climate trajectory." Visually, southern Germany is increasingly shifting toward the historical Mediterranean region. In extreme scenarios for individual parameters, it could even reach values in the future that we currently associate with North Africa (Fig. 2).
The model is currently under development and will soon be made available by Risklayer GmbH in collaboration with the NGO Travel Forward as a free informational tool. It is designed to help tourism industry stakeholders easily understand climate risks. However, these findings are not limited to travelers and hosts. The underlying methodology can easily be applied to other economic sectors and infrastructure challenges.
Associated institut: Risklayer GmbH (Spin-off of KIT/CEDIM)
Autors: Andreas M. Schäfer, Annika Maier, Bijan Khazai, James E. Daniell (Juni 2026)